

CME Group: The dominant derivatives toll bridge
CME Group: The dominant derivatives toll bridge
A Deep Dive into the World's Largest Financial Derivatives Exchange Operator

CME Group, based in Chicago, is the world's largest operator of financial derivatives exchanges, including the Chicago Mercantile Exchange, Chicago Board of Trade, New York Mercantile Exchange, and The Commodity Exchange. These platforms enable trading in a wide range of financial instruments, such as agricultural products, currencies, energy, interest rates, metals, futures contracts, options, stock indexes, and cryptocurrency futures. In 2022, CME Group's futures and options saw an average daily volume of 23.3 million contracts. Trading is conducted through both an open outcry format and the CME Globex Trading System, an electronic trading platform. The company also holds a 27% ownership stake in S&P Dow Jones Indices.
CME Group is also known for pioneering the CME SPAN software, which serves as the official performance bond (margin) mechanism for 50 registered exchanges, clearing organizations, service bureaus, and regulatory agencies worldwide.
Founded in 1898 as a nonprofit corporation, CME Group established its clearing house in 1919. The company demutualized in 2000 and went public via an initial public offering in 2002. Over the years, CME Group has expanded through various acquisitions, including an $8 billion stock transaction for CBOT Holdings in 2007 and the purchase of the New York Mercantile Exchange, which owned both the NYMEX exchange and the Commodity Exchange (COMEX), in 2008.
In 2010, CME Group acquired a majority stake in Dow Jones Indexes. This business was combined with S&P Global's index operations in 2012 to form S&P Dow Jones Indices, in which CME Group maintains a 27% ownership stake.
Business model
CME Group operates on a business model that revolves around facilitating the trading of financial derivatives, providing a platform for market participants to manage their risk exposure and speculate on asset price movements. It primarily focuses on the following aspects:
Trading and Clearing: CME Group's core business is providing a marketplace for trading futures and options contracts. In addition, it also operates as a clearinghouse, managing the counterparty risk associated with these transactions. The company earns revenue from transaction fees, which are based on the volume and type of contracts traded.
Market Data and Information Services: CME Group generates revenue from selling market data, such as historical and real-time trading information, as well as analytical and research tools. Market participants use this data to make informed decisions and develop trading strategies.
Post-Trade Services: CME Group offers various post-trade services, such as trade processing and collateral management, to help market participants manage their risk and streamline their operations. The company earns fees from these services.
Indexes and Licensing: Through its 27% ownership stake in S&P Dow Jones Indices, CME Group earns revenue from licensing fees for the use of benchmark indices in various financial products, such as exchange-traded funds (ETFs) and futures contracts. This also includes the exclusive rights to issue futures contracts on major indices like the S&P 500, Russell 2000, and Nasdaq.
How CME Group Makes Money
CME Group primarily generates revenue through the following sources:
Transaction Fees: The company charges fees for every transaction executed on its trading platforms. These fees are usually based on the volume and type of contracts traded and are the primary source of CME Group's income.
Market Data and Information Services: CME Group sells access to market data, which includes historical and real-time trading information. Clients pay subscription fees for this data, which contributes to the company's revenue.
Post-Trade Services: The company provides post-trade services, such as trade processing and collateral management, and charges fees for these services.
Investment Income: CME Group earns income from its investments, such as securities and other financial instruments.
Transaction fees
CME Group's transaction fees are charges imposed on market participants for executing trades on its trading platforms. These fees are the primary source of revenue for the company and are used to cover the cost of operating and maintaining the trading infrastructure, as well as supporting clearinghouse functions.
Transaction fees vary depending on several factors, including:
Product Type: Different products, such as futures, options, and swaps, may have different fee structures. For example, futures contracts on agricultural commodities might have different fees than those for equity indexes or interest rates.
Contract Size: Some products have tiered fee structures, where the fees depend on the contract's notional value or size. This means that larger contracts may have higher fees, while smaller contracts may have lower fees.
Volume: CME Group often offers volume-based discounts, where market participants who trade higher volumes of contracts receive lower fees per contract. This encourages higher trading activity and liquidity in the marketplace.
Membership Status: CME Group offers various membership levels, with different fee structures for each level. Members may receive discounted fees compared to non-members, depending on their membership type and the products they trade. Some membership types include individual, corporate, and clearing member categories.
Exchange of Contract for Related Positions (ECRP): ECRP transactions, which involve the simultaneous execution of a futures or options contract and a corresponding cash or over-the-counter (OTC) derivative position, may have different fees than regular transactions.
Order Types: Some order types, such as block trades or privately negotiated transactions, may have different fee structures due to their unique nature and execution requirements.
CME Group regularly updates and publishes its fee schedule, which provides detailed information about transaction fees for various products and services. Market participants can consult this schedule to understand the specific fees applicable to their trading activities.
In general, transaction fees are designed to cover the operational costs of the exchange and provide revenue to support its business. These fees help maintain the trading infrastructure and ensure that CME Group can continue to offer a robust and efficient marketplace for derivatives trading.
Market data and analytics
CME Group offers a wide range of market data products and services, which are crucial for market participants to make informed decisions, manage risk, and develop trading strategies. Market data plays a vital role in the financial industry, as it provides transparency, fosters market efficiency, and contributes to price discovery.
CME Group's market data offerings include:
Real-time Data: Real-time data includes live price quotes, trade volume, and order book information for futures, options, and other derivative products traded on CME Group's platforms. This data is essential for traders who need up-to-the-minute information to make decisions and execute trades.
Historical Data: Historical data provides historical price and volume information for various contracts, enabling market participants to analyze trends, develop models, and backtest trading strategies. This data is valuable for research, strategy development, and risk management.
End-of-Day Data: End-of-day data includes the official daily settlement prices, open interest, and volume for each contract. This data is essential for portfolio valuation, mark-to-market calculations, and regulatory reporting.
Index Data: CME Group offers index data for various benchmark indexes, such as the S&P 500 and Dow Jones Industrial Average, which are used as the basis for futures and options contracts. This data is crucial for investors tracking the performance of these indexes and managing related derivative products.
Reference Rates and Fixings: CME Group provides reference rates and fixings for interest rates, foreign exchange, and other asset classes, which serve as benchmarks for pricing and valuation purposes. These rates are widely used by market participants for risk management and to value financial instruments.
Reports and Analytics: CME Group offers various reports and analytics tools, such as commitment of traders (COT) reports, which provide insights into the positioning of large traders in the futures market. These reports can help market participants gauge market sentiment and potential price movements.
Custom Data Solutions: CME Group can provide custom data solutions tailored to the specific needs of market participants, such as bespoke datasets, analytics, or data delivery options.
CME Group offers a comprehensive suite of market data products and services that cater to the diverse needs of market participants. This data is vital for price discovery, informed decision-making, risk management, and regulatory compliance, making it an essential component of the financial ecosystem.
Post trade services
CME Group's post-trade services are a range of services provided to market participants after the execution of a trade. These services are designed to help clients manage their risk, streamline their operations, and ensure regulatory compliance. CME Group generates revenue from post-trade services by charging fees for the various services offered. Here are some key post-trade services provided by CME Group:
Clearing and Settlement: As a clearinghouse, CME Group acts as the central counterparty (CCP) for trades executed on its platforms, managing counterparty risk and ensuring the smooth settlement of transactions. The company collects fees for its clearing and settlement services, which help maintain financial stability and reduce counterparty risk in the marketplace.
Trade Processing: Trade processing services include trade confirmation, affirmation, and allocation, ensuring that trades are accurately recorded and matched between counterparties. CME Group charges fees for these services, which contribute to the company's revenue.
Collateral Management: CME Group offers collateral management services to help market participants optimize their collateral usage and meet margin requirements for their cleared positions. The company collects fees for these services, which can include initial margin, variation margin, and collateral transformation services.
Risk Management: CME Group provides risk management services to help market participants monitor and manage their risk exposure, such as position limits, stress testing, and risk reporting. These services are essential for clients to maintain a clear understanding of their risk exposure and comply with regulatory requirements. CME Group charges fees for these risk management services.
Regulatory Reporting: CME Group offers regulatory reporting services to help market participants fulfill their regulatory obligations, such as trade reporting and position reporting. These services ensure that clients remain compliant with various regulatory requirements, and CME Group earns revenue by charging fees for these services.
Straight-Through Processing (STP): CME Group's STP services enable seamless integration and automation of trade processing workflows between trading, clearing, and back-office systems. By offering these services, CME Group helps clients increase operational efficiency, reduce manual intervention, and minimize errors. Fees for STP services contribute to CME Group's revenue.
Qualitative Assessment
CME Group has witnessed a significant upturn in 2022 after two years of underwhelming revenue growth, largely due to increased market volatility and higher trading volumes across various asset classes. Historically, low short-term interest rates impacted the company's largest revenue source, the interest rate complex. However, with interest rates now rising, this obstacle has diminished, contributing to CME's growth.
The company has also benefited from the surge in retail interest in equity markets, particularly in equity derivative products, leading to remarkable performance in CME's equity index futures business. Although revenue from equity derivatives is expected to normalize over time, factors such as zero-commission trading, investor behavior shifts, and retail accessibility of futures will likely provide lasting support to the equity business.
CME Group holds a dominant position in numerous contracts traded on its exchange and has a diversified product portfolio. In the long run, the company is expected to benefit from the growing need to hedge commodity, energy, and interest rate exposure. CME's ability to generate incremental growth through new futures contracts, such as micro E-mini S&P 500 and bitcoin futures, will also contribute to its success.
The group's stronghold in the U.S. futures market remains unshaken, despite competitors' attempts to enter the market. This is because competition in futures exchanges depends on implicit trading costs and collateral efficiencies rather than transaction fees charged by the exchanges themselves. CME Group's clearinghouse also benefits from network effects, further discouraging new clearinghouses' introduction and posing challenges for new exchanges.
CME Group's intangible assets, including its 27% ownership stake in S&P Dow Jones Indices, ensure exclusive licensing of key futures contracts and contribute to attracting additional equity index futures license agreements. The company has also been successful in monetizing its proprietary trading data to generate additional revenue.
With a robust balance sheet, CME Group can weather future challenges and invest in growth opportunities. The company typically returns most of its operating cash flow to investors via dividend payments, employing a flexible approach that combines a regular quarterly dividend with an annual discretionary cash payout. This structure is well-suited to the company's potential earnings volatility due to market forces.
Quantitative Assessment
When evaluating a company, I focus on several key financial metrics to assess its overall health and investment potential. My goal is to invest in high-quality companies with the highest possible free cash flow yield. Here are the primary financial metrics I use, ranked by their importance to me:
Free Cash Flow (FCF) Yield: This is the most crucial valuation metric I consider, as FCF is the economic lifeblood of a company. FCF yield compares the amount of free cash flow generated by a company to its market price, indicating the percentage of a company's market value produced as free cash flow annually. This metric helps investors assess the attractiveness of an investment by comparing cash yield against risk-free alternatives or other equity investments over time. Higher FCF yields suggest better value and stronger cash-generating abilities. Following Joel Greenblatt's advice, I always think in terms of yield.
Cash Return on Capital Employed (CROCE): This profitability ratio calculates the cash return a company generates on the capital employed in its operations. CROCE is essential for investors as it determines a company's efficiency in utilizing its capital to generate profits. A higher CROCE indicates better capital management and a more efficient business.
Cash Return on Invested Capital (CROIC): CROIC measures a company's cash generated from operations relative to the total capital invested, including both debt and equity. This metric offers insights into a company's ability to generate cash from its investments, which is vital for growth, debt repayment, and shareholder returns. A higher CROIC signifies more efficient capital use.
Average FCF Growth: This metric represents the average annual growth rate of a company's free cash flow over time. Consistent FCF growth demonstrates a company's ability to generate more cash (through reinvestment or unit growth), reflecting operational efficiency and profitability. It is crucial for investors as it signals the company's potential for expansion, investment in new opportunities, and returning capital to shareholders.
Operating Margin: Operating margin measures the proportion of a company's revenue remaining after covering operating expenses such as wages, marketing, sales, rent, and utilities. This indicator is vital for assessing a company's operational efficiency and profitability. A higher operating margin implies better cost management and a more competitive advantage in the industry.
Gross Margin: Gross margin is the difference between a company's revenue and the cost of goods sold (COGS), expressed as a percentage of revenue. It reveals the efficiency of a company in managing its production costs and pricing strategy. A higher gross margin suggests a more profitable business and improved cost control.
Interest Coverage: This solvency ratio evaluates a company's ability to pay interest on its outstanding debt, calculated by dividing a company's operating profits by its interest expense. A higher interest coverage ratio indicates that a company can comfortably meet its interest obligations, signifying a lower risk of default and better financial stability.
Analysis of cash flows
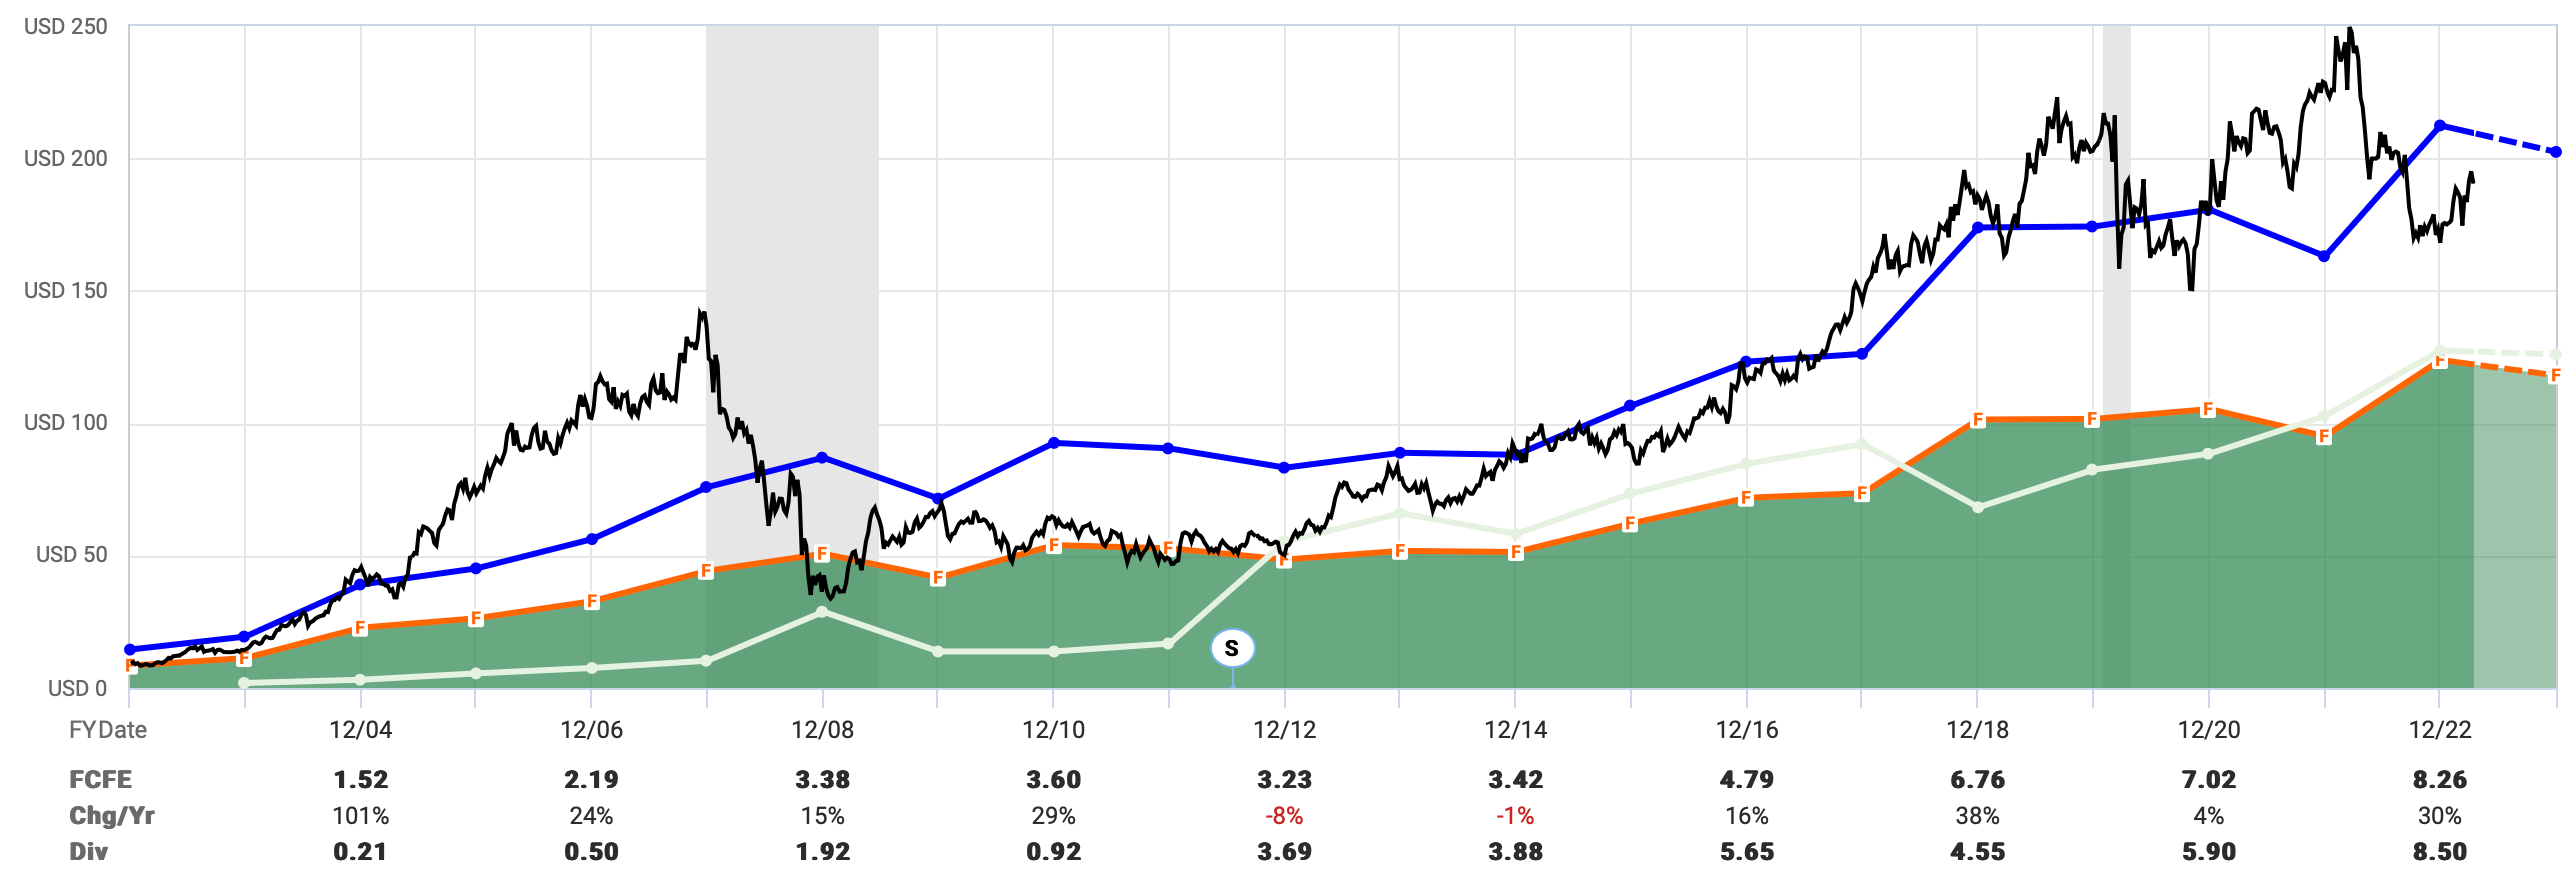
The FASTgraph for CME provides a clear visual representation of several key financial metrics. The black line represents the market price per share, while the orange line with the green area shows the stock price if the company traded at 15x FCF. The blue line depicts the stock price if CME traded at its average valuation over the past 20 years (4% FCF yield), and the white line illustrates the dividend payout per share as a proportion of free cash flow.
Upon examining the graph, several observations stand out:
CME is currently trading at a lower valuation than its average FCF valuation, at 4.3% instead of the typical 4%.
There is a notable similarity between the peak valuations in 2007 and 2022, with both around a 2% FCF yield.
CME's unique dividend policy often relies on the balance sheet, as the payout exceeds the FCF generated.
CME's free cash flow growth per share has had a fascinating trajectory. Between 2002 and 2008, the derivatives market's boom led to an average annual FCF per share growth of 35%. However, since the 2008 downturn, FCF per share has grown at a more modest 6.6% per year on average which, as noted above, could be attributed to the low interest rate environment.
Moving on to the cash flow statement. CME’s capital expenditure is relatively low, averaging around $100 million per year, while the company generates approximately $3 billion in cash from operating the business annually. With only 3% of cash needing reinvestment, the company is not capital-intensive. Additionally, stock-based compensation, at $80 million, is relatively low and does not warrant consideration in this analysis in my opinion.
Analysis of returns
Considering all intangibles, CME Group's CROCE and CROIC are modest yet respectable at 9% and 12%, respectively. As previously mentioned, CME has chosen not to amortize the intangible assets it acquired from CBOT and Nymex, which may distort these measures to some extent.
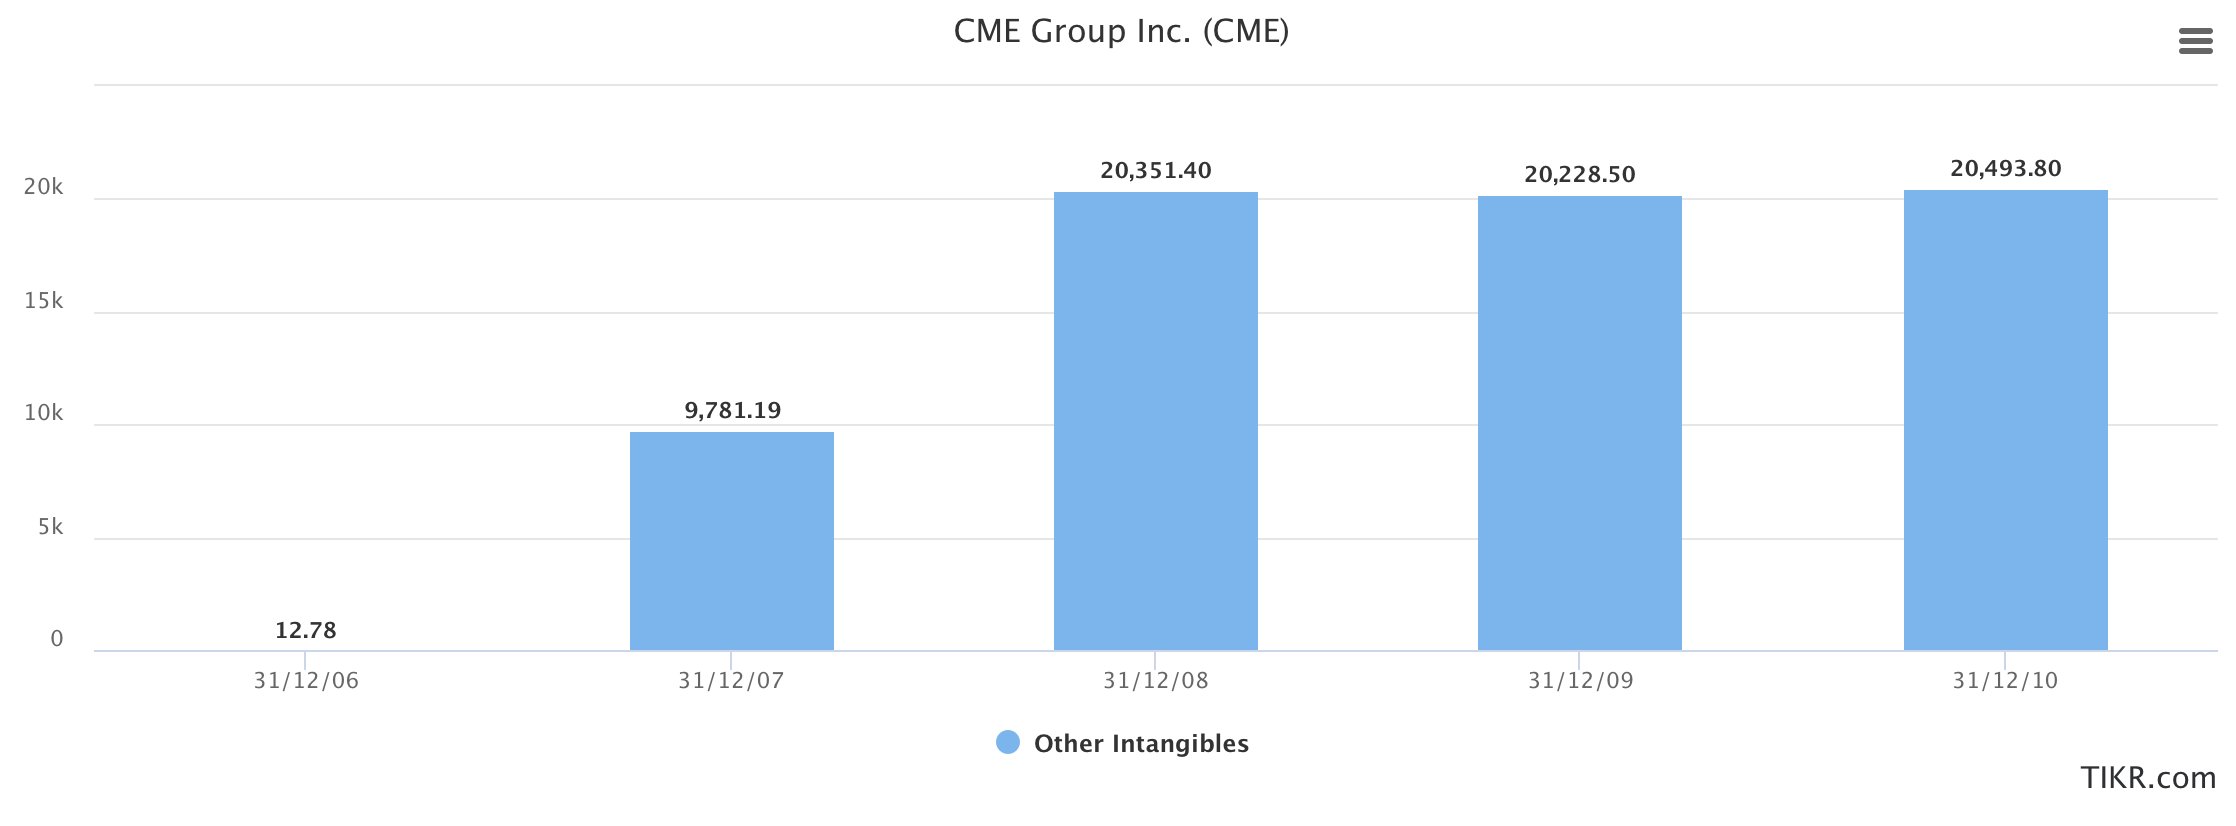
While it is generally not advisable to modify widely accepted formulas, in this case, it seems justified to remove the $20 billion of permanent intangibles from the calculation. By doing so, we obtain a much more impressive—and arguably more accurate—result in the high teens over the past few years.
"Over the long term, it is hard for a stock to earn a much better return than the business which underlies it earns…" - Charlie Munger
Analysis of Margins
CME Group boasts impressive margins, with a 100% gross margin and a 60% operating margin. These high margins reflect the company's strong competitive position, efficient operations, and the unique characteristics of the exchange business.
All of the expense of building the platform that CME operates has already been laid out so now they act as what I like to call a toll bridge. As an exchange operator and clearinghouse, CME Group's primary source of revenue is transaction and clearing fees, which have minimal associated costs. Unlike businesses with substantial direct costs, such as manufacturing or retail, CME's core operations require limited resources beyond maintaining its trading platform, infrastructure, and personnel. This results in a 100% gross margin, as there is no cost of goods sold.
CME Group enjoys significant economies of scale due to its large trading volume and dominant position in the market. As trading volumes increase, the company's predominantly fixed cost structure allows it to spread these costs over a larger revenue base, resulting in higher operating margins. Furthermore, CME Group's infrastructure and technology investments can support additional trading volumes without significant incremental costs.
As laid out in the example in the previous sections, CME Group has considerable pricing power due to its competitive advantages and the nature of futures exchanges. Competition in futures exchanges is largely dependent on implicit trading costs and collateral efficiencies, not the transaction fees charged by the exchanges themselves. This grants CME Group the ability to maintain its historically high operating margin of around 60%.
These factors have enabled the company to consistently generate high gross and operating margins, which are critical to its financial success and shareholder returns. The company acts as a toll bridge for anyone who trades derivatives and futures contracts.
Intrinsic value analysis
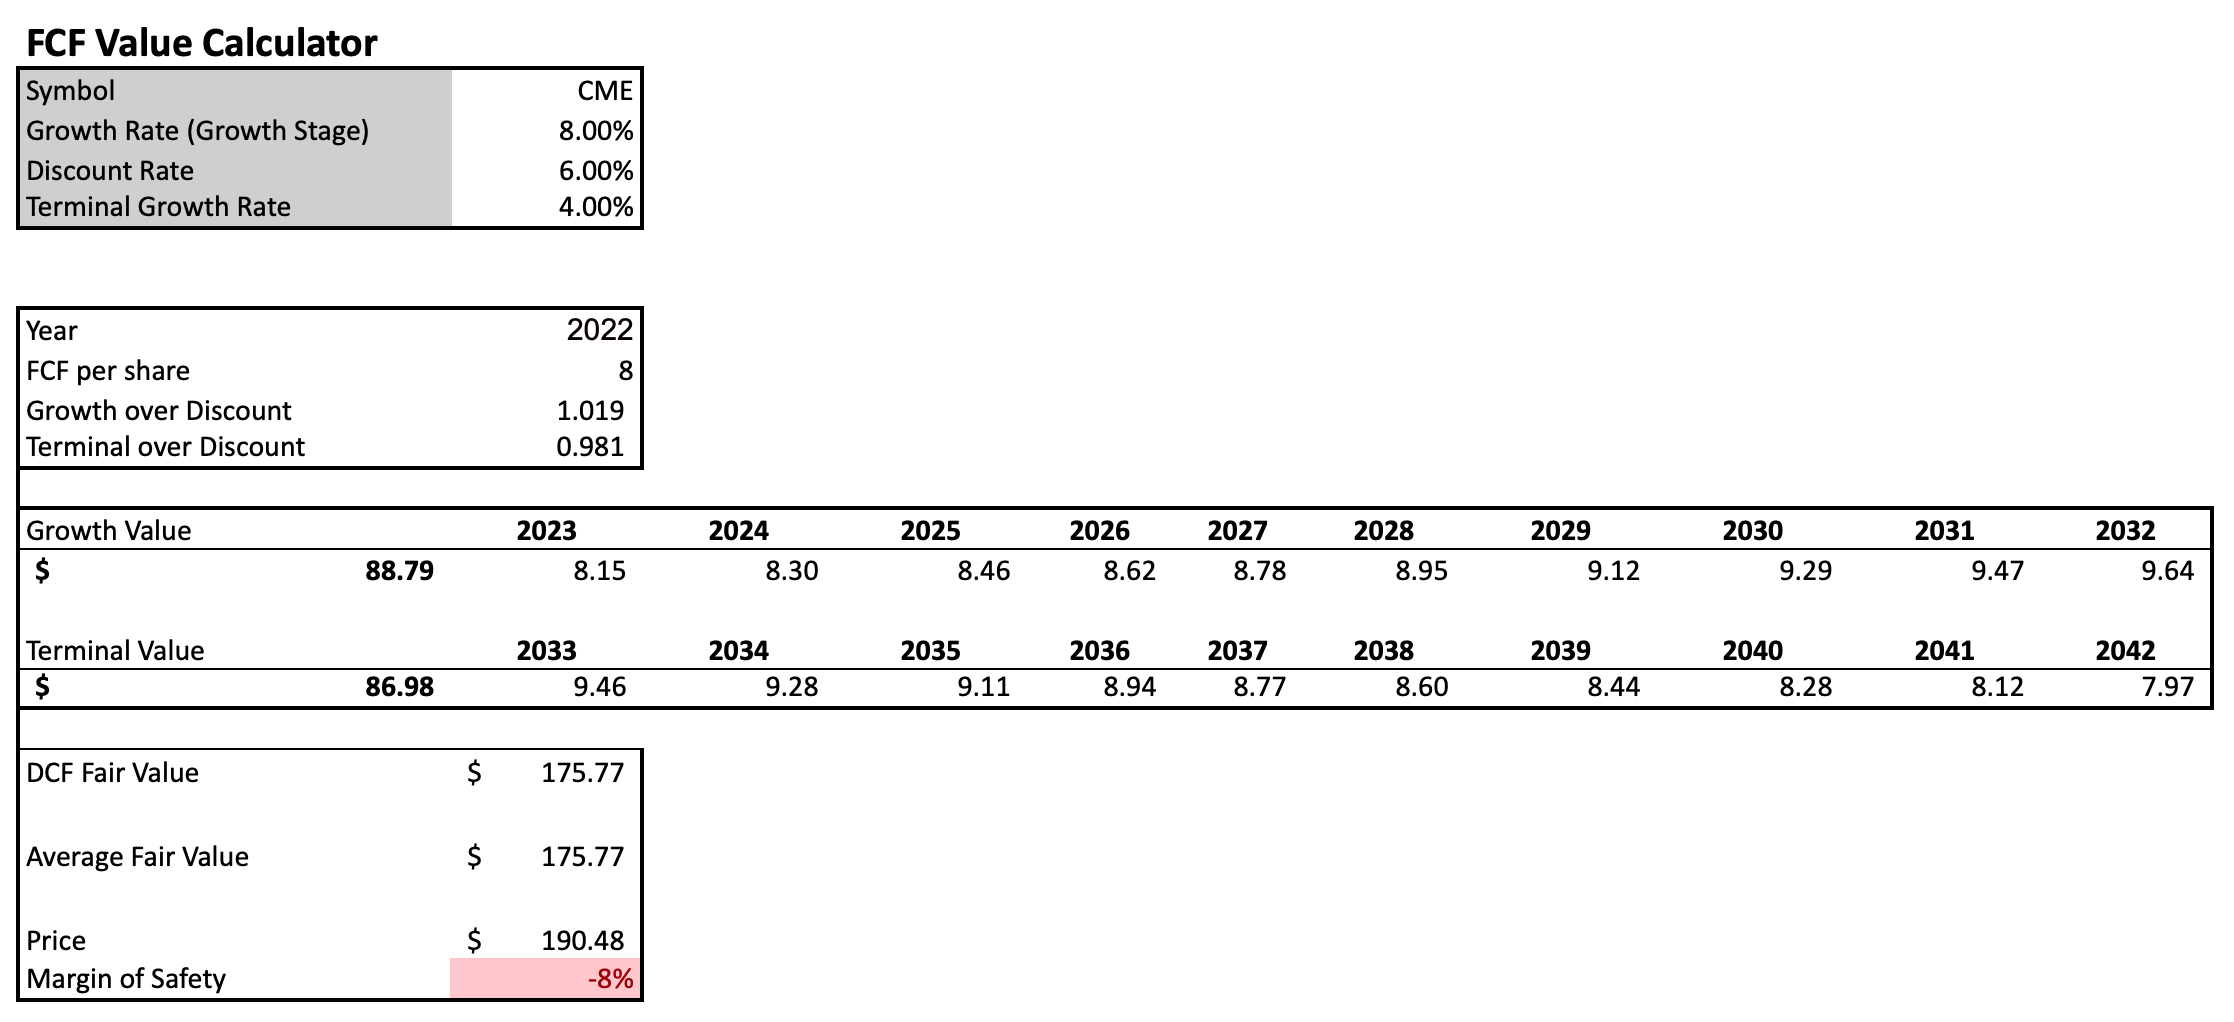
A Discounted Cash Flow (DCF) calculation is the only method for calculating the intrinsic value of companies we analyse. Simply put, a company is worth the cash it can produce from now until a future date X, discounted back at an appropriate rate.
In the DCF calculation above, I've made the following assumptions:
CME Group will be able to leverage the pricing power of its platform as well as a return to a more normalised interest rate environment along with other tailwinds we have discussed to generate 8% per year FCF growth from an $8 per share base for the next 10 years.
I've used Joel Greenblatt's 6% discount rate to provide us with a margin of safety over the risk-free rate of 3.5% at the time of writing.
I've chosen not to use cost of equity or volatility in my calculations, as I believe they are ridiculous to consider when valuing a business (a topic for another article). Instead, I've adopted the approach that it's better to be roughly right than precisely wrong.
Based on these assumptions, the DCF suggests that CME Group is trading slightly above its intrinsic value. However, this valuation likely falls within a range that could be considered fair, given our chosen discount rate. As always, it's crucial to do independent analysis and come to your own conclusions about my assumptions.
Conclusion
CME feels to me like a toll bridge on derivative trading. It requires almost no incremental capital to grow now that the platform has been built. Furthermore, it is probably fair to call the exchange critical infrastructure for companies that are required energy and interest rate hedgers. I do believe there is a non-zero chance that a regulator wakes up one day and increases controls on derivatives due to their explosive nature when used for speculation.
Our evaluation of CME Group's financial metrics, such as FCF yield, CROCE, and CROIC, has shown the company's ability to generate cash and efficiently utilize its capital for growth and shareholder returns. Furthermore, we've highlighted the importance of the company's margin performance, driven by its dominant position in the market, efficient operations, and pricing power.
We also explored CME Group's growth drivers, such as a normalised interest rate environment, increased retail interest in equity derivative markets, and the introduction of new futures contracts. These factors, combined with the company's strong balance sheet and unique dividend structure, provide a solid foundation for future growth and shareholder returns.
As the world becomes increasingly financialised and the desire for derivatives and futures trading continues to grow, CME Group is well-positioned to capitalise on these trends. Its competitive advantages, efficient operations, and exceptional margin performance make it a compelling investment opportunity at the right price.
Please let me know your thoughts on this article. I would be interested to know if this was helpful and informative as well as whether I should explore doing more of these in the future.
Warm regards,
Oliver